VCTE FibroScan Explained: Understanding CAP Steatosis Scores, Liver Stiffness in kPa, & Clinical Cutoffs
A gastroenterologist's definitive clinical handbook for interpreting transient elastography reports. Learn how acoustic shear waves measure hepatic elasticity, how CAP quantifies macrovesicular fat, and why postprandial hyperemia or transaminitis falsely elevate kilopascals.
Key Diagnostic Takeaways
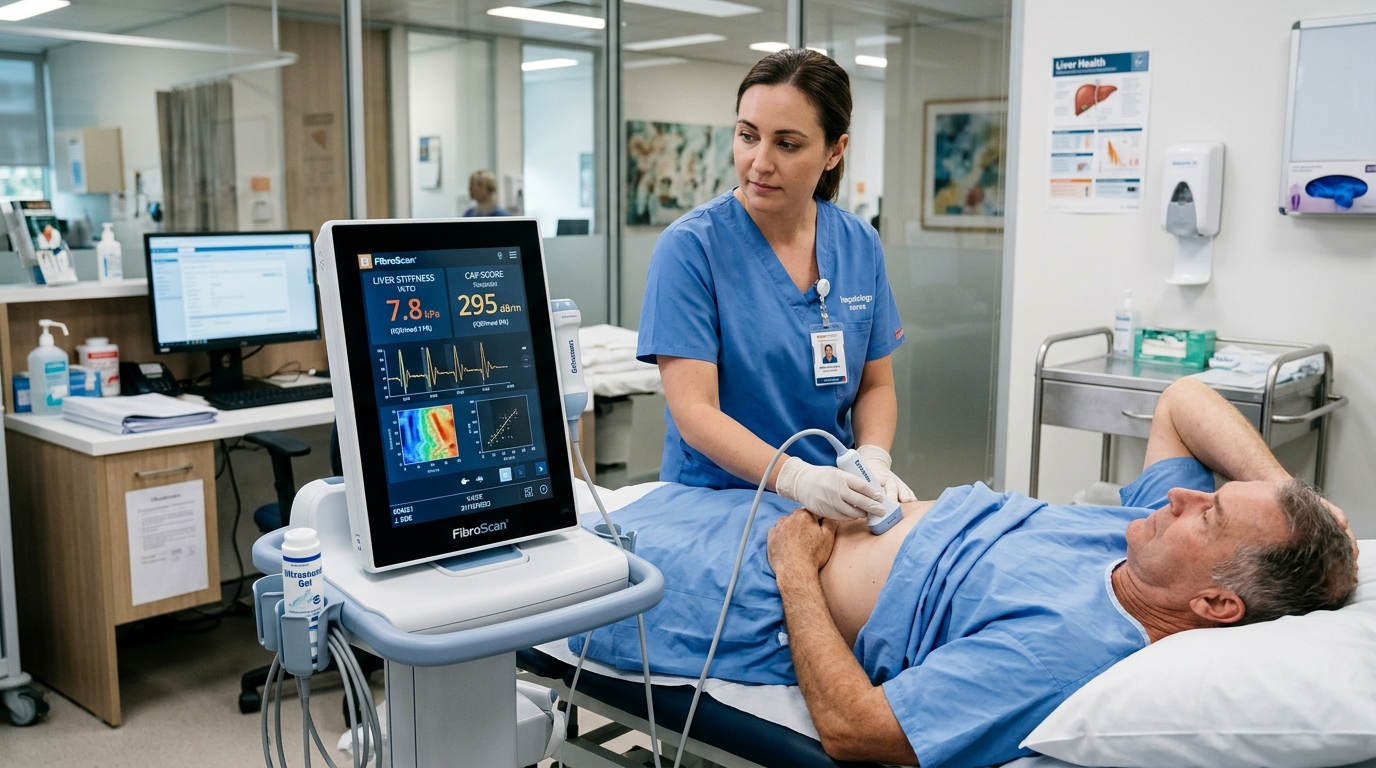
- Dual Biomarker Technology: A single 5-minute FibroScan examination measures two distinct physical parameters simultaneously: Liver Stiffness Measurement (LSM in kPa) for extracellular collagen fibrosis, and Controlled Attenuation Parameter (CAP in dB/m) for intrahepatic fat accumulation.
- The Baveno VII "Rule of 5": Contemporary hepatology consensus stratifies risk through progressive 5-kPa increments: <10 kPa rules out advanced chronic liver disease (cACLD); ≥15 kPa confirms cACLD; ≥20–25 kPa signals clinically significant portal hypertension (CSPH).
- Quality Standards: Reliable diagnostic interpretation requires at least 10 valid acquisitions, a success rate ≥60%, and an interquartile range to median ratio (IQR/M) ≤30%.
- Confounding Elevations: Acute hepatitis with ALT >2–3x ULN, congestive right heart failure, biliary duct obstruction, and recent food consumption within 3 hours produce dramatic false elevations in shear-wave velocity unrelated to actual architectural scarring.
1. The Acoustic Physics of Transient Elastography
Until the early 2000s, clinical evaluation of chronic liver diseases—ranging from viral hepatitis to metabolic dysfunction-associated steatotic liver disease (MASLD)—relied almost entirely on invasive percutaneous needle biopsy. While histology remains a classic benchmark, biopsy assesses only 1/50,000th of the organ volume, carries risk of severe bleeding, and suffers from considerable intra-observer sampling variance.
Vibration-Controlled Transient Elastography (VCTE), pioneered commercially by Echosens as the FibroScan, revolutionized hepatology by providing an instantaneous, painless, point-of-care acoustic assessment. The device interrogates a cylinder of liver tissue approximately 1 cm in diameter and 4 cm in length—a volume roughly 100 times larger than an ordinary core needle biopsy specimen.
The underlying physics relies on physical shear wave propagation. A mechanical transducer piston resting against the patient's right intercostal space emits a mild, low-frequency (50 Hz) mechanical impulse. This vibration launches a mechanical shear wave traversing directly into the right hepatic lobe. As the shear wave travels through liver parenchyma, high-frequency pulse-echo ultrasound tracking beams (3.5 MHz) track the wave's displacement in real time, calculating its propagation velocity (v in meters per second).
According to classic acoustic mechanics in isotropic, elastic biological tissues, physical elasticity is quantified through Young's Modulus (E):
Where ρ (rho) represents tissue mass density (assumed constant at 1,000 kg/m³ for human soft tissues). Because sound waves travel markedly faster through stiff, rigid, collagen-dense fibrotic cords than through soft, flexible, healthy cellular parenchyma, a higher shear-wave velocity directly translates to a higher Liver Stiffness Measurement (LSM), expressed in kilopascals (kPa).
2. Liver Stiffness Measurement (LSM): Staging Fibrosis in Kilopascals
Liver stiffness measurements typically span a dynamic range between 1.5 kPa and 75.0 kPa. In adult clinical practice, hepatologists translate raw kilopascals into standardized METAVIR histologic fibrosis stages (F0 through F4):
| LSM Range (kPa) | METAVIR Stage | Histologic Correlate | Clinical Prognosis & Action |
|---|---|---|---|
| < 6.0 – 7.0 kPa | F0 – F1 | No fibrosis or delicate periportal fibrous expansion | Excellent prognosis; low risk of liver-related mortality; routine metabolic follow-up |
| 7.0 – 8.5 kPa | F2 | Significant fibrosis with periportal and zone 3 perisinusoidal septa | At-risk threshold; candidate for pharmacotherapy evaluation (Resmetirom) and intensive lifestyle modification |
| 8.5 – 12.0 kPa | F3 | Advanced bridging fibrosis (portal-portal or portal-central connections) | High risk of imminent transition to cirrhosis; strict quarterly/semiannual hepatology surveillance |
| ≥ 12.0 – 15.0 kPa | F4 | Established cirrhosis (diffuse nodular regenerative architecture) | Compensated advanced chronic liver disease; requires semiannual ultrasound HCC surveillance and Baveno VII variceal evaluation |
The Baveno VII "Rule of 5" and Portal Hypertension
In 2021, the international Baveno VII consensus conference (de Franchis et al., J Hepatol 2022; PMID: 35120736) established the modern "Rule of 5" framework to predict clinically significant portal hypertension (CSPH; defined as hepatic venous pressure gradient [HVPG] ≥ 10 mmHg):
- LSM < 10 kPa: Excludes compensated advanced chronic liver disease (cACLD) with high certainty.
- LSM 10 – 15 kPa: Suggestive of cACLD; prompts close clinical monitoring.
- LSM 15 – 20 kPa: Confirms cACLD; warrants risk stratification for esophageal varices.
- LSM ≥ 20 – 25 kPa: Presumptive diagnosis of clinically significant portal hypertension. Patients with an LSM ≥ 20 kPa or platelet count ≤ 150,000/μL require screening upper endoscopy (EGD) or empirical non-selective beta-blocker therapy (e.g., carvedilol) to prevent decompensating variceal hemorrhage. Conversely, patients with LSM < 20 kPa AND platelets > 150,000/μL can safely avoid screening endoscopy due to a < 5% risk of high-risk varices.
3. Controlled Attenuation Parameter (CAP): Quantifying Hepatic Steatosis
While LSM assesses architectural fibrosis, the Controlled Attenuation Parameter (CAP) quantifies intrahepatic fat (steatosis). As high-frequency ultrasound waves travel through biological tissues, their energy is absorbed and scattered—a phenomenon termed acoustic attenuation.
Intracellular lipid vacuoles (triglycerides) attenuate ultrasound energy at a vastly higher rate than healthy glycogen- or water-rich hepatocytes (Sasso et al., Clin Res Hepatol Gastroenterol 2012; PMID: 21920839). By computing the slope of ultrasonic signal loss at 3.5 MHz along the axis of propagation, FibroScan calculates CAP, reported in decibels per meter (dB/m):
| CAP Score (dB/m) | Steatosis Grade | Histological Fat Percentage | Clinical Classification |
|---|---|---|---|
| < 248 dB/m | S0 | < 5% hepatocytes | Normal hepatic parenchyma; no significant steatosis |
| 248 – 268 dB/m | S1 | 5% – 33% hepatocytes | Mild macrovesicular steatosis; early metabolic dysfunction |
| 268 – 280 dB/m | S2 | 34% – 66% hepatocytes | Moderate steatosis; substantial intracellular triglyceride storage |
| > 280 dB/m | S3 | > 66% hepatocytes | Severe steatosis; diffuse lipid packing; strong link to high HOMA-IR |
4. Quality Criteria & Probe Selection: M vs. XL
A FibroScan report is clinically valid only if strict technical acquisition parameters are satisfied by the operator. When reviewing your diagnostic report, look for these three mandatory quality benchmarks:
- Number of Valid Acquisitions: Minimum of 10 valid shots recorded in the identical intercostal anatomical location.
- Success Rate: Valid acquisitions divided by total machine attempts must be ≥ 60%.
- IQR/M Ratio: The ratio of the Interquartile Range to the Median stiffness value must be ≤ 30% (for example, if median LSM is 10.0 kPa, the IQR spread must not exceed 3.0 kPa). An IQR/M > 30% indicates high measurement dispersion and invalidates the examination.
Managing Subcutaneous Adiposity with the XL Probe
The standard "M" transducer probe measures shear waves between 25 mm and 65 mm beneath the skin surface. However, in individuals with severe central obesity, a skin-to-liver capsule distance (SCD) exceeding 25 mm causes rapid attenuation of the ultrasound tracking beam, leading to measurement failure.
To resolve this limitation, modern FibroScan devices incorporate an automated probe selection tool and a dedicated "XL" probe. The XL probe utilizes a lower center frequency (2.5 MHz vs. 3.5 MHz), a larger transducer face, a deeper focal depth (35 mm to 75 mm), and increased vibration amplitude. Utilizing the XL probe when SCD > 25 mm rescues over 90% of previously unmeasurable obese patients, yielding highly reliable LSM and CAP concordances (Eddowes et al., Gastroenterology 2019; PMID: 30689971).
5. Crucial Confounders: Why Liver Stiffness Can Be Falsely High
An elevated LSM in kilopascals does not always mean irreversible collagen scar tissue. Several physiological and pathological states acutely increase intrahepatic pressure, mimicking advanced fibrosis:
1. Acute Transaminitis / Hepatitis Flare
When ALT or AST surges above 2 to 3 times the upper limit of normal, acute hepatocellular necrosis, cellular swelling, and inflammatory edema stiffen the hepatic parenchyma. An LSM of 14 kPa during an acute hepatitis flare often regresses back to 5.5 kPa once inflammation subsides.
2. Passive Hepatic Congestion
Right-sided congestive heart failure, severe tricuspid regurgitation, or constrictive pericarditis elevate central venous pressure. Back-pressure directly engorges the hepatic veins and sinusoids with stagnant blood, driving LSM into cirrhotic ranges (>20 kPa) in livers with zero true histological collagen deposition.
3. Extrahepatic Biliary Obstruction
Choledocholithiasis (gallstones obstructing the common bile duct) or strictures create biliary hydrostatic back-pressure and periductal edema, resulting in artificial elevations in shear-wave velocity that resolve rapidly following endoscopic biliary decompression (ERCP).
4. The Postprandial State (Failure to Fast)
Ingesting a meal prompts splanchnic hyperemia, delivering a massive surge of portal blood flow into the liver. This transient vascular engorgement increases LSM by 1.5 to 3.0 kPa. Patients must fast for at least 3 to 4 hours prior to testing to ensure baseline hemodynamics.
6. Peer-Reviewed Clinical Citations (PubMed References)
1. de Franchis R, Bosch J, Garcia-Tsao G, et al. Baveno VII - Renewing consensus in portal hypertension. J Hepatol. 2022;76(4):959-974. PMID: 35120736
2. Sasso M, Beaugrand M, de Ledinghen V, et al. Controlled attenuation parameter (CAP): a novel tool for the non-invasive evaluation of steatosis using FibroScan. Clin Res Hepatol Gastroenterol. 2012;36(1):13-20. PMID: 21920839
3. Eddowes PJ, Sasso M, Allison M, et al. Accuracy of FibroScan Controlled Attenuation Parameter and Liver Stiffness Measurement in Assessing Steatosis and Fibrosis in Patients With Nonalcoholic Fatty Liver Disease. Gastroenterology. 2019;156(6):1717-1730. PMID: 30689971
4. Castera L, Friedrich-Rust M, Loomba R. Non-invasive Assessment of Liver Disease in Patients With Nonalcoholic Fatty Liver Disease. Gastroenterology. 2019;156(5):1264-1281. PMID: 30660725
Frequently Asked Questions: VCTE & FibroScan Testing
What is considered a normal liver stiffness measurement (LSM) on FibroScan?
In a healthy adult without active hepatic inflammation or congestion, a normal liver stiffness measurement is typically below 6.0 to 7.0 kilopascals (kPa). Values between 2.0 and 6.0 kPa indicate the absence of significant scar tissue (stage F0 to F1). An LSM exceeding 7.0 kPa suggests significant fibrosis (F2), while values above 12.0 to 15.0 kPa strongly correlate with advanced fibrosis or cirrhosis (F4).
How does the Controlled Attenuation Parameter (CAP) measure liver fat?
Controlled Attenuation Parameter (CAP) quantifies ultrasound beam attenuation as it travels through liver tissue, reported in decibels per meter (dB/m). Intracellular triglyceride droplets absorb and scatter sound waves significantly more than healthy water-dense hepatocytes. A CAP score below 248 dB/m is normal (S0), 248 to 268 dB/m indicates mild steatosis (S1), 268 to 280 dB/m indicates moderate steatosis (S2), and scores above 280 dB/m represent severe steatosis (S3) affecting over 66% of hepatocytes.
Why must you fast for at least 3 hours before a FibroScan exam?
Digesting food triggers postprandial splanchnic hyperemia—a physiological surge of blood volume delivered into the portal vein and liver parenchyma. This acute increase in vascular pressure and blood volume transiently swells hepatocytes and increases acoustic resistance, falsely elevating liver stiffness by 1.5 to 3.0 kPa. Fasting for a minimum of 3 to 4 hours ensures baseline hemodynamic conditions and prevents false-positive overestimation of fibrosis stage.